
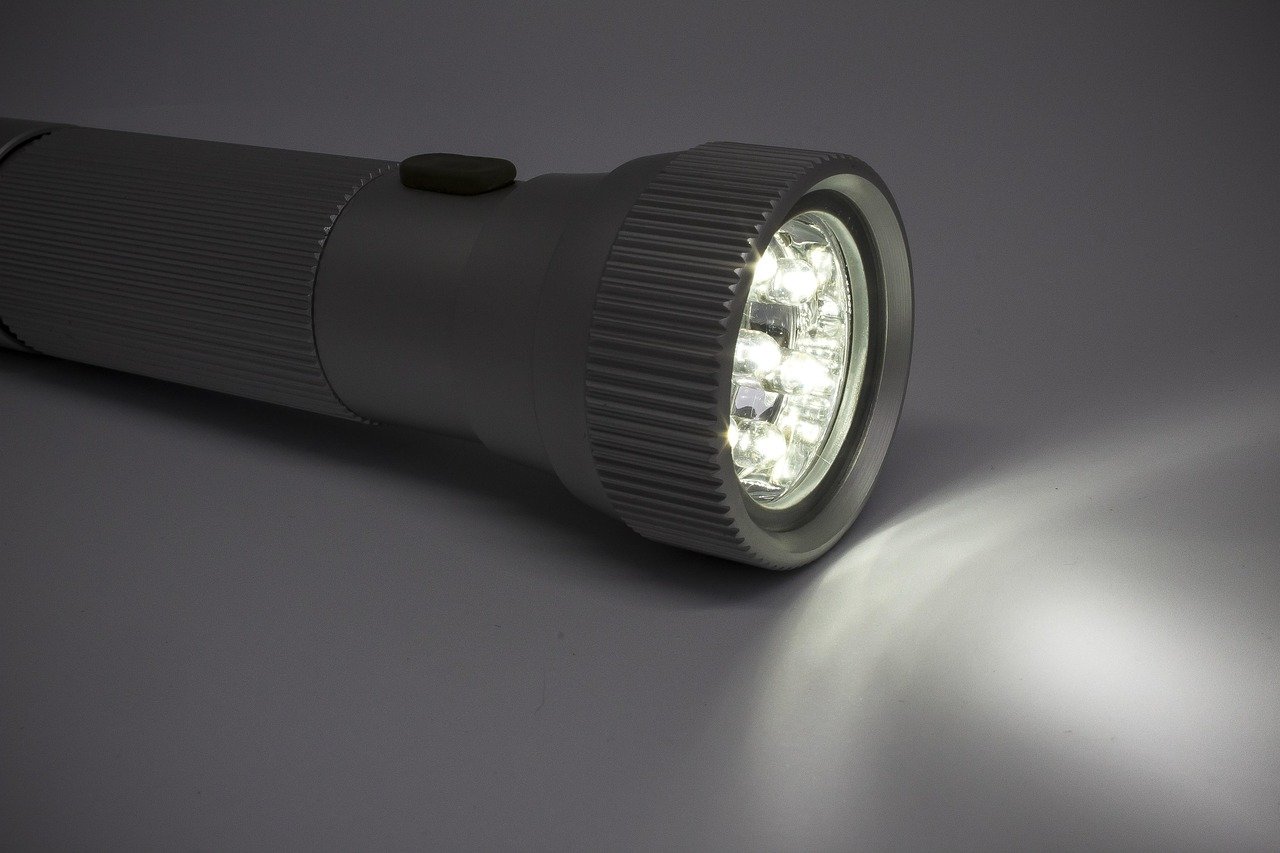
Lab runtimes assume perfect batteries and cooling — real life rarely matches.
A light that runs at turbo for the first minute then plunges into dim mode mid-hike is a familiar scene. Multiple technical causes — thermal step‑down from high draw, battery chemistry and cold sensitivity, mixed or weak cells, driver inefficiency and real‑world loads — commonly combine rather than a single defective part. Don’t panic. Tactical lights are included; see what is a tactical flashlight for basic context.
- Turbo modes often force thermal step‑down in seconds–minutes, sharply reducing output.
- Cold temperature can cut usable lithium‑ion capacity roughly 20–50%.
- Mixed or high‑resistance cells cause voltage sag and premature cutoff.
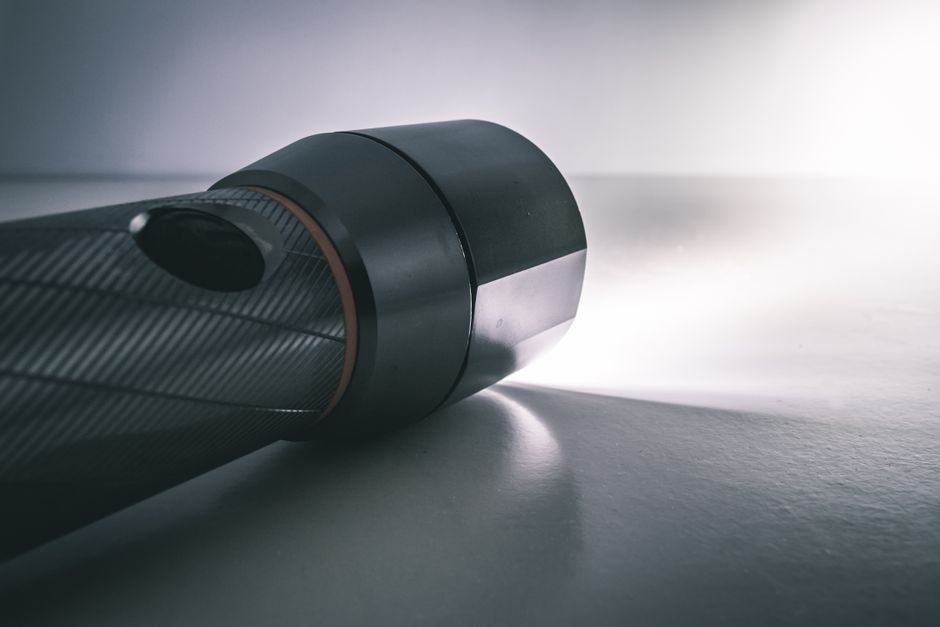
Immediate bright burst, then fast dim
A lamp that lights at full output for a few seconds and then falls sharply reflects electronic step-down. It does not indicate a dead cell. Instead, current limiting, thermal regulation, or other protection measures are at work. Modern flashlight drivers respond to safety limits by reducing brightness quickly.
Modern drivers monitor current and temperature. They reduce output rapidly to protect the LED and components. This also protects the battery when safe operating limits are approached. In flashlight runtime specs, you will see this behavior described. It helps prevent LED damage and battery stress during tests.
How to tell designed behavior from a fault
- If the head or body becomes warm before dimming: thermal regulation is likely. Dimming follows heat rise.
- If brightness drops after a fixed short interval (few seconds) regardless of temperature: the driver may implement an intentional ramp or timed step-down (high-power turbo → programmed lower mode).
- If a multimeter shows reasonable battery voltage but the lamp still dims instantly under load: the driver or its current-limiter is implicated rather than the cell.
Quick diagnostic checks and operational fixes
- Run the lamp in a lower, sustained mode to confirm longer runtime.
- Operate in short bursts (pulses) instead of continuous turbo to keep average temperature/current down.
- Let the lamp cool between high-power runs; repeated turbo cycles indicate thermal limit reached.
These steps distinguish normal electronic protection from true faults and often restore expected performance without replacing the cell.
Try sustained mode or short bursts to confirm designed behavior.
Battery chemistry, current draw, and voltage sag
High continuous current causes two related effects that shorten real-world runtimes: voltage sag and reduced usable capacity. Additionally, at high discharge rates, a cell’s internal resistance turns energy into heat and drops terminal voltage. This often triggers the flashlight’s low-voltage cutoff before the cell’s rated capacity is used, per flashlight runtime specs.
How discharge rate cuts usable mAh
- Internal resistance (mΩ): higher resistance → larger voltage drop at a given current. Even nominally identical cells can differ by several tens of milliohms.
- Effective capacity loss: many lithium cells deliver significantly less capacity at 2–5C than at 0.2C; this is analogous to the Peukert effect for other chemistries.
- Protected or mismatched cells: protection PCBs can trip under high pulses, while older or counterfeit cells show higher resistance and earlier sag.
Practical diagnosis and fixes
- Measure the flashlight’s continuous current draw and the cell voltage under load; compare to the cell’s rated continuous discharge (A) and internal resistance if available.
- Switch to high‑drain cells rated for the actual continuous current (look for cells specified for 10–30A continuous for many high-power lights).
- Avoid protected cells or cells with unknown provenance for high‑current applications; retest runtime with a known‑good, fresh high‑drain cell.
- If voltage sags but current is within the cell’s rating, inspect contacts, spring resistance, and the driver for additional losses.
Retesting after swapping to a verified low-R, high-drain cell often reveals whether chemistry is the limiting factor. Additionally, it indicates whether the chemistry or the light’s electronics are the limiting factor.
Progressive runtime decline — causes and fixes
Over months a flashlight’s runtime often declines progressively rather than failing suddenly. Several slow‑acting mechanisms reduce usable capacity and increase voltage sag.
- Cell aging and raised internal resistance: repeated cycles increase internal resistance, reducing usable mAh and generating more heat.
- Poor charging habits: partial charges, long storage at high voltage, and cheap chargers can accelerate capacity loss.
- Loss of spring tension or poor contact pressure: weaker springs raise contact resistance, producing larger voltage drop under load.
- Corrosion and dirty contacts: oxidized or contaminated surfaces increase resistance at connections.
- Mechanical wear and heating: repeated thermal cycling can loosen joints and degrade solder or plating.
Prioritized maintenance steps (highest impact first):
- Capacity check under load: use a charger/analyzer or a fixed resistive load to measure mAh and end voltage.
- Replace high‑IR cells: match chemistry, capacity, and internal resistance; prefer low‑R high‑drain cells for high‑current lights.
- Clean contacts: remove oxidation with contact cleaner and a brush; dry fully before reassembly.
- Restore spring tension: re‑tension or replace springs; ensure plating and alignment for good pressure.
- Verify charger and storage practices: adopt correct charge cycles and store cells at recommended voltages.
Following this priority often restores most runtime without replacing the entire flashlight.
Handle cells safely. Use matched cells in multi‑cell packs, avoid shorting, inspect wraps and springs, and recycle damaged cells per local regulations.
How test semantics change the numbers
Many runtime claims are shorthand for different test protocols.
They are not a single ‘how long it will last’ figure.
Manufacturers often publish a short-lived peak burst number.
Additionally, longer sustained flashlight runtime specs accompany the short-lived peak figures that assume the driver has stepped down.
Common endpoints and what they mean
- Time to step-down: when the driver reduces output to protect thermal/driver limits. This can be minutes or seconds.
- Time to cutoff: battery drained and light turns off. Longer but less useful for usable illumination.
- Time to n% output: often reported as time until output falls to 10% or a specified lux; useful for real-world usability.
Test-cell factors shift numbers dramatically.
Additionally, these factors include ambient temperature, airflow, fixture mounting, and cell age, plus the measurement method.
Footnotes often state 25°C, brand-new cells, and no airflow, affecting flashlight runtime specs.
Prefer full FL1 runtime curves or complete output-vs-time graphs over single numbers. Curves show step-downs, duty cycles, and real thermal behavior; always read footnotes for cell condition, measurement distance, and endpoint definition.
Definitions to decode specs
- Peak burst
The initial maximum output measured during the first seconds; not sustainable and often exaggerated for marketing.
- Sustained runtime
The period the light holds regulated output before driver stepdown or until a specified lower output threshold.
- Stepdown
Automatic reduction of output by the driver to limit temperature or current; marks the end of ‘maximum’ runtime.
- Cutoff
The moment the battery can no longer drive the emitter and the light turns off; not the same as usable brightness.
- FL1 curve
Standardized output-versus-time graph (ANSI/NEMA FL1) showing real behaviour over a run rather than a single endpoint.
Accessory and setup checklist
-
Remove external modules and remotes
Unplug USB charging modules and remotes; test the light bare. Add‑on electronics can draw standby current or suffer internal loss.
-
Disable or isolate indicator LEDs
Cover or disconnect indicator/status LEDs. Even low‑current LEDs and drivers can cumulatively shorten long runs.
-
Bypass adapters and thin sleeves
Make direct cell‑to‑driver contact. Extra metal interfaces raise resistance and worsen voltage sag under load.
-
Use matched, high‑drain cells
Test with identical fresh cells only. Mixed age, capacity or thin cells cause early cutoff and uneven load sharing.
-
Check for parasitic draw
Measure standby/current draw with a meter or USB power meter; simple lights should be microamp to low‑milliamp. Higher values indicate a drain.
-
Inspect and clean contacts
Check springs, threads and cell fit for wobble or insulating residue; clean and reassemble firmly, then retest.
Controlled home runtime test — step‑by‑step
- 1. Prepare cells and torch
Start with fully charged cells (use a quality charger and the same cell pair or single cell type the light accepts). Fit the head, tailcap, and any adapters exactly as for normal use; clean contacts with isopropyl alcohol.
- 2. Record ambient and gear
Log room temperature, barometric pressure if available, and the exact model of cells. Use a stopwatch, a DC power meter or inline current shunt, and a luxmeter or lumen gun if available.
- 3. Define endpoints and cadence
Run until the light steps down to a defined endpoint (for example, 10% of initial output or when the manufacturer spec ends). Record output, voltage, and current every minute for the first 10 minutes, then every 5–10 minutes thereafter.
- 4. Swaps and control runs
Repeat the test with a known good, high‑drain cell of the same chemistry and with freshly cleaned contacts. Also run one test while ambient temperature is ~10–15°C higher to check thermal regulation effects.
- 5. Evidence for warranty/RMA
Save continuous logs, timestamped photos or video showing the start, key stepdowns, and final state; keep original cell labels and charger logs. Note serial numbers and firmware versions if applicable.
Stop immediately if cells swell, overheat, emit odor, or smoke. Use insulated tools, test in a ventilated area, and avoid mixing old and new cells. For best reproducibility, run three full cycles and report the median curve; attach raw logs and media when filing a warranty claim.
Frequently Asked Questions
Why does my flashlight dim after just a few seconds on turbo mode?
This is almost always intentional thermal stepdown — not a defect. Modern flashlight drivers monitor temperature and current, and automatically reduce output to protect the LED, driver components, and battery when safe operating limits are approached. If the head or body becomes warm before dimming, thermal regulation is the cause. If it steps down after a fixed short interval regardless of temperature, the driver has a programmed timed stepdown from turbo to a sustainable output level.
Why is my actual runtime so much shorter than what the manufacturer claims?
Manufacturers typically test under ideal laboratory conditions: room temperature around 25°C, brand-new cells at full charge, no airflow restrictions, and short initial high-output bursts. Real-world use involves ambient temperature variation, older or weaker cells with higher internal resistance, contact resistance, and sustained high draws. The difference between the advertised peak burst duration and the sustained regulated output is the most common source of disappointment.
How much does cold weather reduce flashlight runtime?
Cold temperature can cut usable lithium-ion capacity roughly 20–50% depending on the severity. At sub-freezing temperatures, cell voltage sags under load more quickly, which triggers the flashlight’s low-voltage cutoff before the cell is truly depleted by charge. Keeping the flashlight and spare cells warm (close to the body) helps maintain runtime in cold environments.
What is voltage sag and why does it matter for runtime?
Voltage sag occurs when a battery cell’s internal resistance causes its terminal voltage to drop under heavy current draw. When voltage sags low enough to hit the flashlight driver’s low-voltage cutoff point, the light shuts off or steps down — even though the cell still has significant charge remaining. High-drain cells with lower internal resistance produce less voltage sag under load, which is why switching to quality high-drain cells often dramatically improves runtime at high output settings.
What does an FL1 runtime curve actually show?
An FL1 runtime curve is a standardized output-versus-time graph (per ANSI/NEMA FL1 standards) that shows how brightness changes over a full discharge cycle. Rather than a single number, it reveals stepdowns, duty cycles, and real thermal behavior — including when the driver reduces output and how the light behaves as the battery depletes. Curves are much more informative than single runtime numbers because they show the actual usable brightness over time, not just when the light finally turns off.
Decision flow and prioritized fixes
- Swap to known high‑drain cells first — fastest, simplest triage.
- Run a short controlled load test (5–10 min) to produce evidence.
- Clean contacts and replace O‑rings before filing warranty claims.
Quick decision flow: swap to known high‑drain cells and check resting voltage. If runtime recovers, replace batteries. If not, run a controlled load test (5–10 minutes) and log voltage/brightness: rapid voltage sag → cells or contact resistance; steady voltage with early dim → thermal or driver stepdown. Inspect and clean contacts, re‑lube O‑rings, and remove adapters. Prioritized fixes: battery swap; clean contacts and replace O‑rings; controlled load diagnosis; thermal/driver evaluation; gather logs and pursue warranty or manufacturer support if hardware faults persist.
Rated runtime only means something against a specific model. Our Wuben X-Series round-up lists the real figures across that range, and the Olight Warrior vs Fenix PD35 comparison shows how two tactical lights hold output as their cells drain.
Runtime claims vary as much between makers as between lights. Five tactical flashlights compared notes which of them hold usable output longest, and why the heavier ones do it better.




10 Comments
Totally relates — I had a headlamp that did a 30s turbo burst then dropped to dim mode. Turned out to be thermal limiting, not the cells.
Swapping to a lower-drain mode and giving it a cooling gap fixed useability for my hikes. Good to know the difference between electronic stepdown and a dying battery.
Added some data from my side: I tested mixed cell sets (one old, one new) and got much worse runtime than two new ones. Voltage sag and internal resistance differences were obvious.
Followed the decision flow — swapped batteries first, then cleaned contacts, then ran a controlled test. If you mix cells, don’t be surprised if runtime is well below spec.
Short comment: my light had accessory electronics (a charging board) inside the tailcap causing parasitic drain. Removed it and runtime returned almost to spec.
I ran the controlled home runtime test from the article and logged voltage every minute. My older 18650s showed heavy voltage sag after 10–12 minutes at high current, which matches the battery chemistry section.
After cleaning the contacts and swapping to fresh low‑R cells, runtime improved by about 20%. Still, the FL1 numbers are kind of useless unless you know the test current — thanks for pointing that out.
Thanks for sharing your logs, Mike — that’s exactly the kind of evidence I recommend when filing a warranty. A couple of tips: when you log, also note ambient temperature and measure contact resistance if possible. If you still see >150 mV drop under load at the cell terminals, the cell is likely past its useful life even if nominal mAh looks okay.
Mine was progressive decline over months. Replacing the springs and reflowing a couple solder joints on the driver fixed most of it. Lesson: contact resistance matters way more than I thought.
Question: the article says thermal regulation can look like a fast dim after an initial spike. How do you tell that apart from a protective electronic stepdown? My light seems to do both depending on mode.
Good question, Lisa. Quick diagnostic: run a controlled test at constant current and monitor the head temperature and voltage.
If dimming correlates tightly with temperature rise and you see the driver current maintained until the dim, it’s thermal limiting. If the driver reduces current abruptly without a matching temp rise, that’s an electronic stepdown or programmed ramp. Watching the FL1 curve or your own logged output vs temperature usually makes the cause clear.
I was skeptical about the FL1 curve idea but made my own curve for two lights.
One had a single-number runtime that matched peak output only. The curve showed a long plateau at low output, which was useless for my camping. The other manufacturer published full curves and I could compare usable lumen-hours. Lesson: demand the curve, not the headline number.
Totally — I called a brand out on their single-number claim and they finally sent a curve. Mine showed massive temperature throttling after 5 minutes; warranty accepted when I sent the curve screenshot.